Omaha Economic Index
Many individual data points exist to measure the health of specific sectors in the Omaha metropolitan area. Colliers | Nebraska provides a single source to measure the health of the overall local economy, from the “Great Recession” to the Covid-19 crisis and beyond.
How do these events affect our local market? Find out here!


Colliers | Nebraska built the Omaha Economic Index® based on over two dozen key indicators from federal, state and local government sources as well as select internal data. All data points used measure the health of the economy of the seven counties making up the Omaha MSA *.
About
Index At-A-Glance
189.9
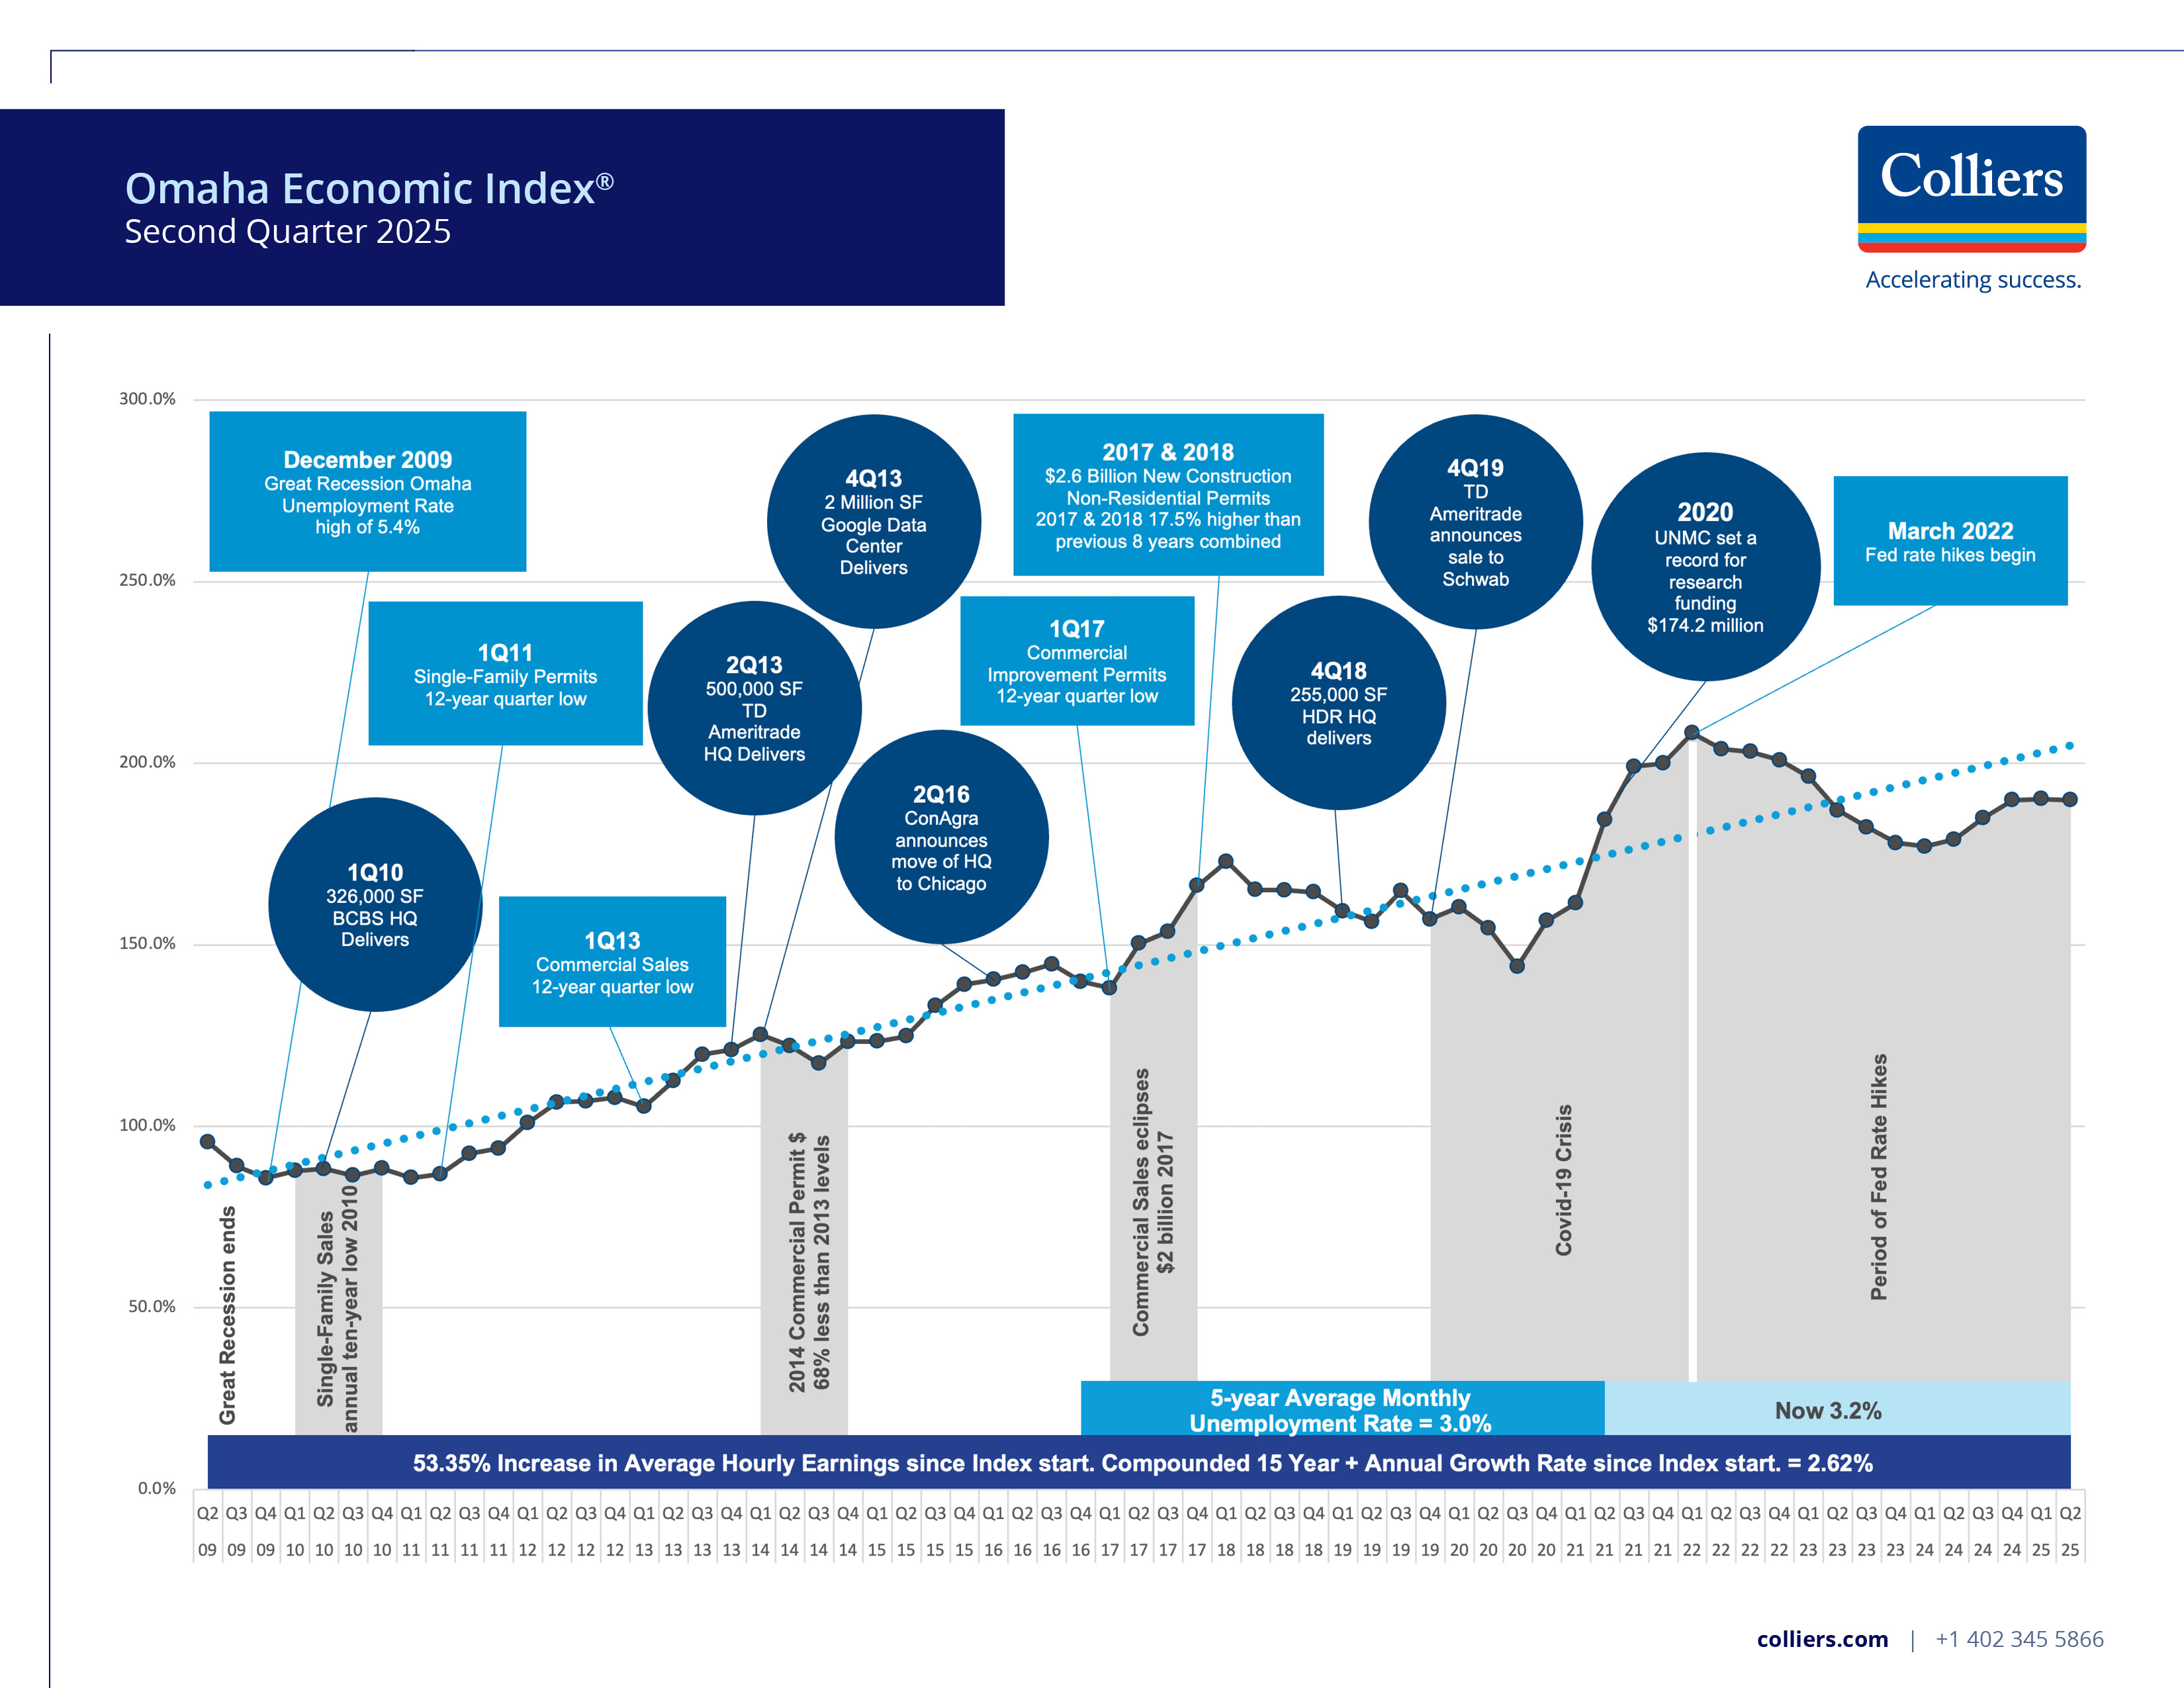
2025 Second Quarter Index


Historical Look
The Omaha Economic Index® uses a 12-year window starting in 2009 near the end of the Great Recession. The time span provides users with over a decade-long historical look, including key events that impact the results.

Index Formulations
Historical Look
Shape of Index
Begin at 100
Major Drivers

The general shape of the Omaha Economic Index® is a solid, mostly steady climb upwards, which is not surprising given Omaha’s historical stable growth (versus the high/low swings that can be found in economies in large or coastal cities).
Shape of Index
Index Formulations
Historical Look
Shape of Index
Begin at 100
Major Drivers
The Omaha Economic Index® begins at 100 in the first quarter of 2009, just before the official end of the Great Recession. After the Great Recession, the Omaha economy continued to head downward for another six months, before stabilizing between late 2009 and the middle of 2011. Since that time, the local Omaha economy has grown and flourished.
Begin at 100
Index Formulations
Historical Look
Shape of Index
Begin at 100
Major Drivers
Home Sales - The real estate market is a key economic indicator. Omaha single-family home sales hit an annual ten year low during 2010 and hit an all-time high in the third quarter of 2021. Home sales are an indicator that the economy is doing well and a rise in sales shows the economy strengthening.
New Construction Pricing - New construction average price was up almost 16 percent over the past year and is now $496,538.
Real Estate
Index Formulations
Historical Look
Shape of Index
Begin at 100
Major Drivers
Both average hourly wages and average weekly earnings are up almost 44 percent from 2010. The wages will continue to be a driving force in the economy.
Wages
Index Formulations
Historical Look
Shape of Index
Begin at 100
Major Drivers
2025 First Quarter Index
190.2
2024 Second Quarter Index
179.0
Current
Index
2025 Second Quarter
In the second quarter of 2025, the Omaha Economic Index® decreased slightly to 189.9, down from 190.2 in the previous quarter. This represents a modest 0.3-point decrease quarter-over-quarter and a 10.9-point drop compared to the same period last year.
Our Experts

Jessica Moline
Director of Market Research
jessica.moline@colliers.com
Disclaimers

About
01
Current Index
02
Our Experts
03


The Omaha Economic Index™ uses several data sources to calculate the overall index value. The actual formulation is proprietary to Colliers International | Omaha.
Learn more about the creation of the Omaha Economic Index™ by clicking the items in the menu at right.
Index Formulations
Index Formulations
Historical Look
Shape of Index
Begin at 100
Major Drivers
download press release
* All data points used in the Omaha Economic Index® measure the health of the economy of the seven counties that make up the Omaha Metropolitan Statistical Area (MSA); Douglas, Sarpy, Cass, and Washington counties in Nebraska and Pottawattamie, Mills and Harrison counties in Iowa.
The calculations used in the Omaha Economic Index® are proprietary to Colliers | Nebraska, and its creators, Jessica Moline and Ed Fleming.
The Omaha Economic Index® is general communication being provided for informational purposes only. It is educational in nature and not designed to be as advice or a recommendation for any specific investment, strategy, plan or other purpose in any jurisdiction. All information presented herein is considered to be accurate at the time of production, but no warranty of accuracy is given and no liability in respect of any error or omission is accepted.
®
Colliers | Nebraska sought to find a way to objectively calculate and quantify the health of the Omaha market with hard facts and data versus the "gut feeling" many our our clients have told us they've been using when making decisions that impact their business. Thus, we created the Omaha Economic Index®. Colliers | Nebraska has been providing commercial real estate services to our clients throughout Nebraska for 37 years.
join our mailing list
Be the first to know -
The Omaha Economic Index® will be updated on a quarterly basis and the findings will be available to Colliers | Nebraska clients and anyone who wishes to receive the updates.
For more information, sign up to receive quarterly Index reports:
- Real Estate
- Wages
- Real Estate
- Wages
- Real Estate
- Wages
- Real Estate
- Wages
- Real Estate
- Wages
- Real Estate
- Wages
Colliers | Nebraska
11516 Miracle Hills Drive, Suite 400 Omaha, NE 68154 +1 402 345 5866
Visit my bio

download index graph
The Omaha Economic Index® uses several data sources to calculate the overall index value. The actual formulation is proprietary to Colliers | Nebraska.
Learn more about the creation of the Omaha Economic Index® by clicking the links at right.
Index Formulations
Colliers | Nebraska
11516 Miracle Hills Drive, Suite 400 Omaha, NE 68154 +1 402 345 5866
* All data points used in the Omaha Economic Index™ measure the health of the economy of the seven counties that make up the Omaha Metropolitan Statistical Area (MSA); Douglas, Sarpy, Cass, and Washington counties in Nebraska and Pottawattamie, Mills and Harrison counties in Iowa.
The calculations used in the Omaha Economic Index™ are proprietary to Colliers International | Omaha, and its creators, Melissa Torrez and Ed Fleming.
The Omaha Economic Index™ is general communication being provided for informational purposes only. It is educational in nature and not designed to be as advice or a recommendation for any specific investment, strategy, plan or other purpose in any jurisdiction. All information presented herein is considered to be accurate at the time of production, but no warranty of accuracy is given and no liability in respect of any error or omission is accepted.
Disclaimers

Ed Fleming
Executive Vice President, Principal
ed.fleming@colliers.com
Visit my bio
Visit my bio
Jessica Moline
Director of Market Research
jessica.moline@colliers.com
Visit my bio
Jessica Moline
Director of Market Research
jessica.moline@colliers.com
Visit my bio